
Investing in the stock market is a fancy euphemism for gambling. But unlike traditional brick-and-mortar joints with slots, craps, and blackjack, the Crazy Capitalist Casino allows you to bet on the house – and the house always wins. How can the average retail investor adopt a healthy risk-and-reward mindset? Math Over Myth!
Math Over Myth removes romance and mythology from investing to focus strictly on price movements, mathematics, and technical analysis. Regardless of long term value and growth prospects in medicinal psychedelics, the public market space is still very young and volatile. While fundamentals aren’t entirely irrelevant, adopting a savvy gambler mentality requires a healthy dose of nihilism in this department.
Betting on emerging, disruptive, and speculative sectors of the marketplace doesn’t necessarily need to be a risky endeavor if you approach it with the right mindset, formulate a plan which allows you to remove the romance from the good time and not second-guess your strategy during bad times. Today we refocus on the psychedelic biotech company MindMed and its stock performance in the two weeks since my initial deep dive.
MindMed (Nasdaq: MNMD | NEO: MMED)
After markets closed yesterday, MNMD was sitting at $6.12/share and cryptically announced a private equity offering with neither specifying a price per share nor amount of shares to be sold. As a result, the stock dove over 30% in after hours trading. This comes on the heels of MNMD stock plunging after a 1:15 reverse split, intended to be a last ditch effort to meet Nasdaq’s listing requirements, but harming investors by sucking liquidity from MNMD stock. Moreover, CEO Robert Barrow disclosed the sale of almost 7K shares of MNMD yesterday to satisfy withholding taxes.
Prior to the markets opening this morning, the plot thickened. MNMD announced the size and price of their cryptic private placement late last night: 7.05M shares at 4.25/share for a capital raise of approximately $30M USD. Each common share is also accompanied by a common share purchase warrant. In this morning’s pre-market session, MNMD stock was still down around 35% but opened the regular trading session down a whopping 50% at $3.04/share. News of a massive capital raise at a share price below market will typically precede a public market parity to the offering price; however, MNMD opened approximately 28.5% below the offering price. Why?
Let’s look back at MindMed’s cash flow in two simple areas in the last fiscal year, 2021. Total executive compensation exceeded $35M, including CEO Robert Barrow, Chief Medical Officer, Executive President, a former co-CEO, and a former CEO. Contrarily, R&D spend was just under $35M. One need not be a savvy mathematician to ponder whether or not that $35M was well spent on fattening the pockets of executives overseeing a company whose stock is down about 91% YoY, 86% YTD, 82% in the last six months, and 74% in the last month alone!
Moreover, The Dales Report posted an interesting tweet yesterday evening with a screenshot from a message board, in which Freeman Capital Management (FCM) insinuates today’s MNMD offering may be the result of regulatory action taken by FCM in Canada to prevent MindMed from further diluting shareholders (MNMD trades under MMED in Canada). However, this capital raise is occurring in the United States, perhaps explaining why the underwritten offering is not occurring in Canada. Regardless, it’s not a pretty picture.
But this is exactly why Math Over Myth is vital to protecting your neck in this stock gambling game. My analysis from two weeks ago still holds. I remain a master strategist:
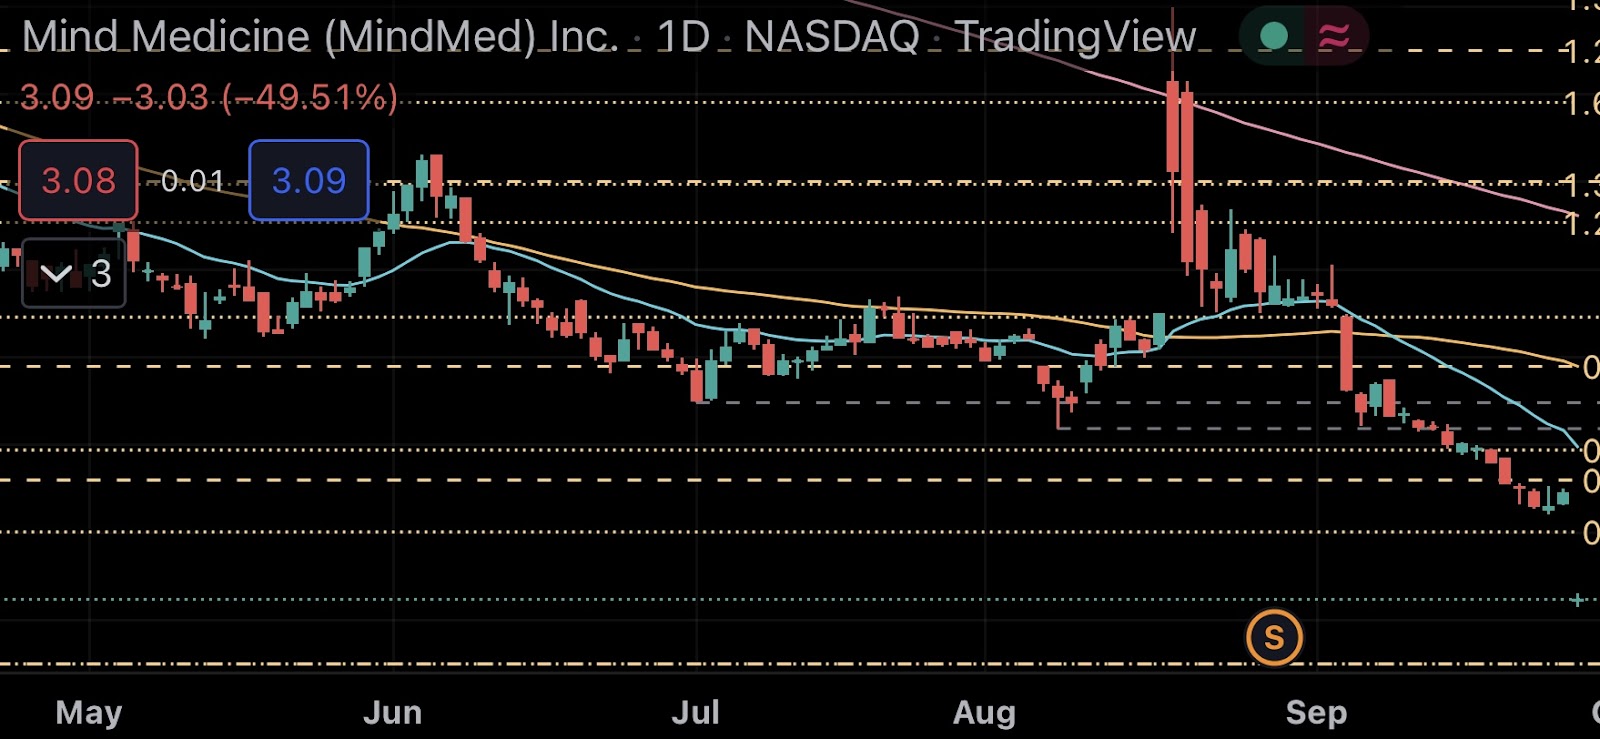
According to the chart’s technicals, MNMD hasn’t been a buy since its price dipped below the 20W EMA in July 2021, and it still isn’t. The 20 week exponential moving average (20W EMA) in blue and the 50 week simple moving average (50W SMA) in gold are both sloping downwards at a steep rate. No stock is a buy when a chart is upside down like MNMD. It’s just that simple to determine if the stock is a buy. Quick answer – NO!
An upside down chart is a negative situation with the shorter term moving averages below the longer term ones. A healthy chart will showcase the 20W EMA above the 50W SMA, for example. When the 20 moves above the 50, it’s a positive indicator called a Golden Cross. When the opposite happens, it’s a negative indicator called a Death Cross. Speaking of a Death Cross, let’s zoom in on the daily chart once again for a real time example.
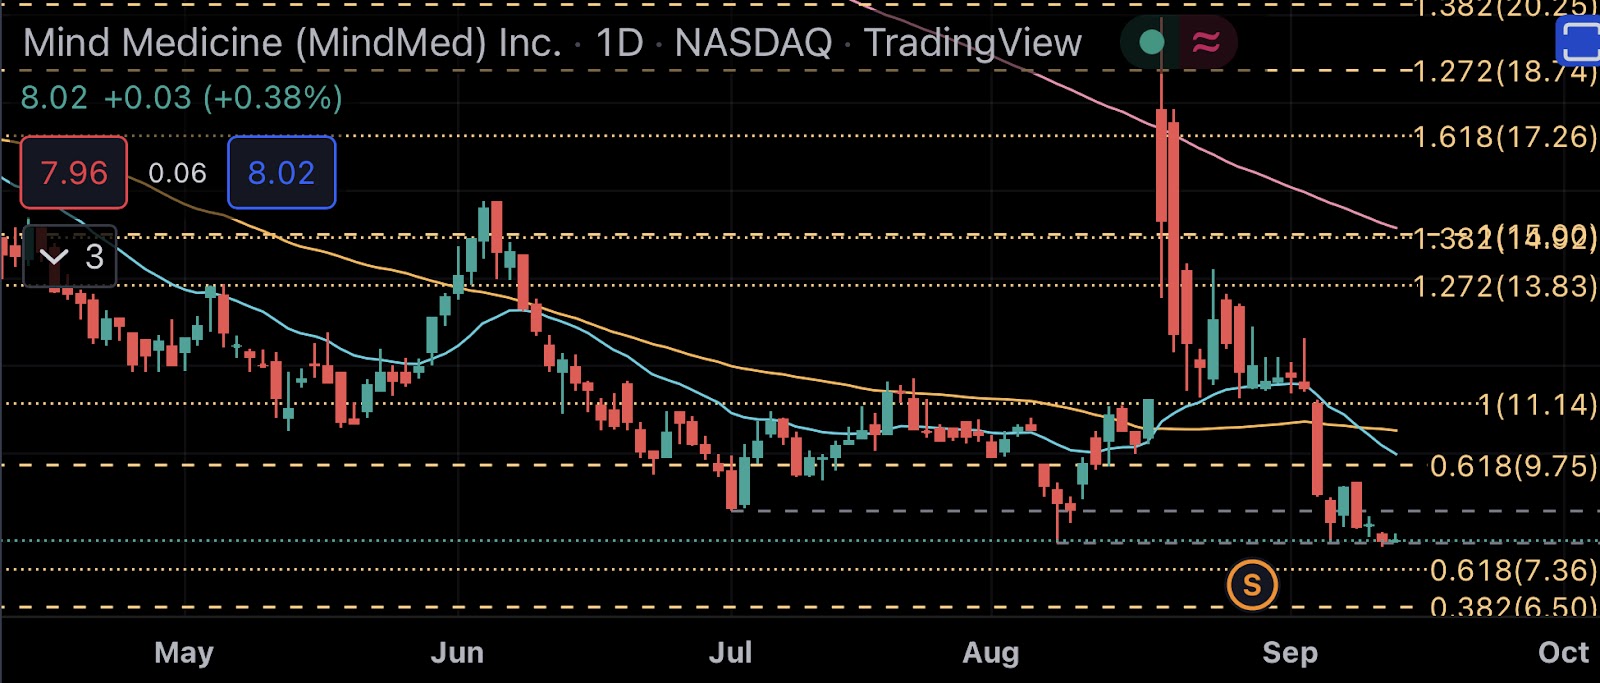
MNMD stock experienced a Death Cross earlier this week, as shown by the 20D EMA crossing below the 50D SMA, and represents a huge red flag to professional gamblers, indicating pain can worsen as sellers are in firm command of the price action. Fibonacci levels help navigate these price capitulations, as the chart shows MNMD’s price constantly moving down from mid August 2022 until today, hitting each Fib level on the way down just like… a (spiral) staircase!
MNMD’s next obvious price support levels, below its local bottom, are $7.36 and $6.50. If there’s a sustained breach below $6.50/share, don’t forget about the $5.03 level
Reverse Split
What happened in August that caused such volatility? MNMD’s stock price fell out of compliance with the Nasdaq’s covenant of a $4/share minimum, facing potential delisting, and moving back to the OTC Markets. Just as a company will split their stock price when it becomes too high for psychological and liquidity reasons, companies can also do a reverse split to make their price per share higher. MNMD multiplied their stock price by a factor of 15, thus reducing the outstanding share count by that same denominator.
However, reverse splits are overwhelmingly devastating for shareholders. Instead of adding liquidity to the market by making the purchase price more attractive to retail traders, this strategy creates more artificial scarcity by lowering the share count, attracting short sellers, and subjecting the stock to more volatility. I can’t recall a reverse split situation in which the stock didn’t fall at least 60% after the irrational, unsustainable announcement pump. MNMD’s local bottom of $7.86/share represents a move approximately 61% lower thus far.
Further downside is expected, but not nothing is etched in stone. Investing like a professional isn’t difficult, it just requires discipline not succumbing to FOMO and hype, as well as a bit of knowledge about price movements, market momentum, and how to read a stock chart with moving averages and Fibonacci levels. My Math Over Myth Primer explains certain terminology in more depth and detail to develop a sound gambling strategy.
Conclusions
MNMD is underperforming the major ETFs over the past year by large gaps. The relative outperformance by the S&P 500, Nasdaq 100, and Biotech ETFs showcase how passively betting on the house through ETFs is more consistent and diversified, with less stress and worry, even during a bear market.
After this Fibonacci technical analysis deep dive, I’m certainly not advocating a passive ETF strategy, but rather highlighting the disparity between blindly buying stocks that carry “an ability to disrupt, innovate, and change health care” hype versus utilizing provable metrics to determine if price movements and market momentum paint a positive or negative picture.
You don’t need to catch the very bottom to successfully gamble in the stock market. Market bottoms are only formed in hindsight. All you need is patience, discipline, and a keen determination to protect your investment by steadfastly adhering to a strategy that removes romance and mythology from your decisions.
Regardless of what people tell themselves, nothing about playing the stock market involves pride or ego, it’s just about money. The more educated an investor, the more information they have to determine a risk-reward scenario which reconciles to their investment horizons and cash management. Understanding all possible price scenarios and trajectories by utilizing technical analysis tools like Fibonacci levels and moving averages give any aspiring gambler a competitive edge by bestowing the power of predetermination unto themselves. Leverage it to your full advantage.
Craig D. Schlesinger is the CFO of PSYC Corp & Spotlight Media and a market analyst with over twenty years experience predicting price movements and trend reversals in various sectors. Follow his #MathOverMyth technical analysis and him on Twitter: @PSYCCraig
Math Over Myth Primer | Math Over Myth Archive
Craig holds no positions in MNMD, QQQ, SPY or XBI