
Investing in the stock market is a fancy euphemism for gambling. But unlike traditional brick-and-mortar joints with slots, craps, and blackjack, the Crazy Capitalist Casino allows you to bet on the house – and the house always wins. How can the average retail investor adopt a healthy risk-and-reward mindset? Math Over Myth!
Math Over Myth removes the romance and mythology from investing to focus strictly on price movements, mathematics, and technical analysis. Regardless of the long term value and growth prospects of medicinal psychedelics writ large, the public market space is still very young and volatile. While fundamentals aren’t entirely irrelevant, adopting a savvy gambler mentality requires a healthy dose of nihilism in this department.
Betting on emerging, disruptive, and speculative sectors of the marketplace doesn’t necessarily need to be a risky endeavor if you approach it with the right mindset, formulate a plan which allows you to remove the romance from the good time and not second-guess your strategy during bad times. Today we focus on the psychedelic biotech company MindMed’s stock chart and Fibonacci technical analysis.
The late, great Robert Crew said it best in season four of HBO’s The Wire as Joseph ‘Proposition Joe’ Stewart, “A man learns best when he get burned.” Coincidentally, Prop Joe was referring to fellow Baltimore drug dealer Marlo Stanfield getting ripped off at a high stakes poker game. Fibonacci number sequences can be your loyal friend to avoid “getting took” while navigating that other high stakes skill game — the Crazy Capitalist Casino!

What are Fibonacci Numbers?
Thankfully, centuries of work already contributed to this ever-growing discipline. A 13th century mathematician from Pisa, Tuscany named Leonardo Bonacci, later known as Fibonacci, popularized the Indo-Arabic numeral system in the West through his 1202 work Liber Abaci (Book of Calculation), in which he introduced Europe to the Fibonacci numbers sequence:
Fibonacci numbers appear unexpectedly often in mathematics, so much so that there is an entire journal dedicated to their study, the Fibonacci Quarterly. Applications of Fibonacci numbers include computer algorithms such as the Fibonacci search technique and the Fibonacci heap data structure, and graphs called Fibonacci cubes used for interconnecting parallel and distributed systems. They also appear in biological settings, such as branching in trees, the arrangement of leaves on a stem, the fruit sprouts of a pineapple, the flowering of an artichoke, an uncurling fern, and the arrangement of a pine cone’s bracts.
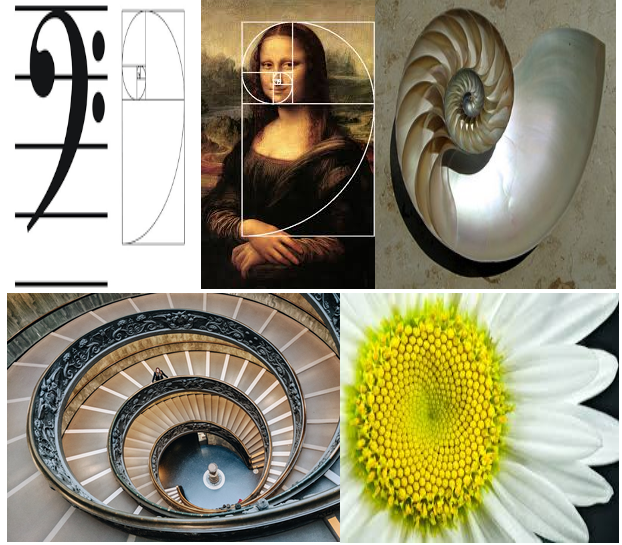
Examples of Fibonacci curves, sequences, and spirals are all around us every day, including sea shells, sunflowers, the bass clef, a spiral staircase, and even the Mona Lisa!
But how did a 13th century Italian mathematician end up being so relevant to analyzing price movements in the modern stock market? It’s entirely based on the Fibonacci number sequence: 0, 1, 1, 2, 3, 5, 8, 13, 21, 34, 55, 89, 144, …
Each number is the sum of the two preceding ones. On a stock chart, key Fibonacci levels identify and predict price consolidations with horizontal lines. The only real trick is knowing how to start an accurate setup.
MindMed (Nasdaq: MNMD | NEO: MMED)
Before the markets opened this morning, MNMD announced that, as a result of their recent 1:15 reverse stock split, they are once again in compliance with Nasdaq’s listing requirements. What is a reverse stock split and why did MNMD feel the need to execute that strategy? How does Fibonacci analysis help navigate the price movements? Let’s begin by zooming out to grab the backstory on MNMD’s price action to answer those questions.
Where’s MNMD been?
MNMD began trading in the US in March 2020 under $4/share, rallied to over $11/share, and quickly bottomed out at $1.25/share on March 5 (all share prices retroactively reflect post reverse split prices) per share. Here is the first crucial moment for setting up your Fibonacci analysis on MNMD’s daily chart. The most important thing to know is the top and bottom of the trading range. The Fib tool on your trading platform does the rest for you. On the right of the chart you can see both the Fib levels and their corresponding prices.
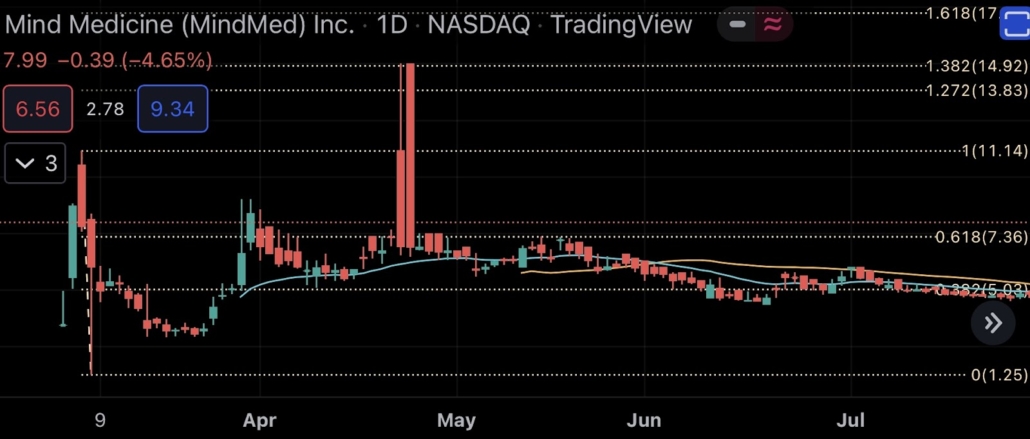
Since hitting that low of $1.25/share (which is still MNMD’s all time low), MNMD promptly rallied to $15/share. As illustrated by the Fibonacci levels (dotted yellow lines, dotted red is current price), MNMD’s rally hit several critical levels and serves as a great example of how prices move. The 38.2% level of $5.03 began as support but didn’t hold, as the price dipped about halfway between that level and its range bottom of 1.25/share before attempting to retest $5.03. On the third attempt, MNMD broke and sustained above its 38.2% Fib, temporarily clearing its next critical level of 61.8% or $7.36, approximately halfway between $7.36 and the range top of $11.14 or 100%.
In predictable Fib fashion, the 61.8% level acted as resistance, while the 38.2% level converted from old resistance into new support. The stock pulled back to $5.03/share and promptly retested its 61.8% Fib level. A short sputtering breakout followed on the fourth and fifth attempts, reaching $15/share intraday in consecutive sessions, but were knocked down by its Fib levels of 138.2%, 100%, and ultimately 61.8% acted as active resistance once again. Under such a scenario, professional gamblers are taking profits around the 127.2-138.2% levels, knowing that a clear break above two consecutive Fib levels is unlikely to sustain in the short term.
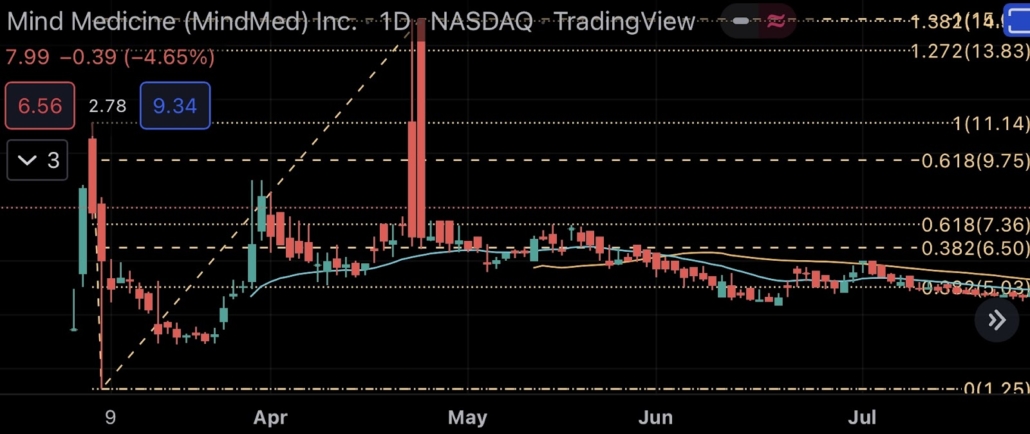
Moreover, MNMD’s rally to $15/share sets up a new Fibonacci scenario to analyze. The first chart will show it alone (dashed yellow lines) and the second with both.
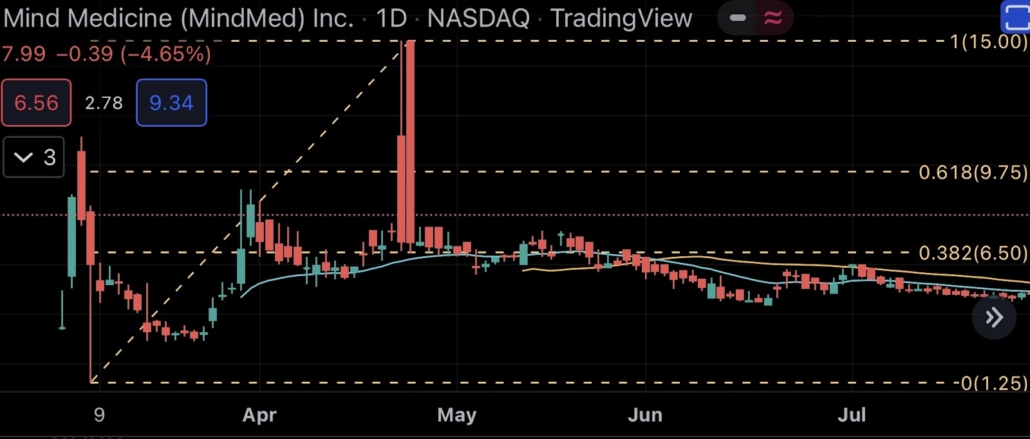
Now our chart setup is ready for whatever price action comes MNMD’s way. For long term clarity we’ll look at the weekly chart from 2021-2022.
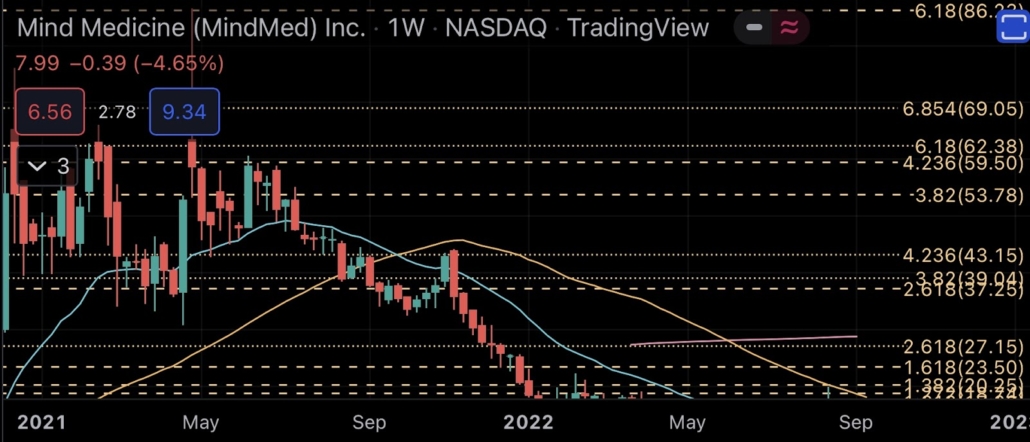
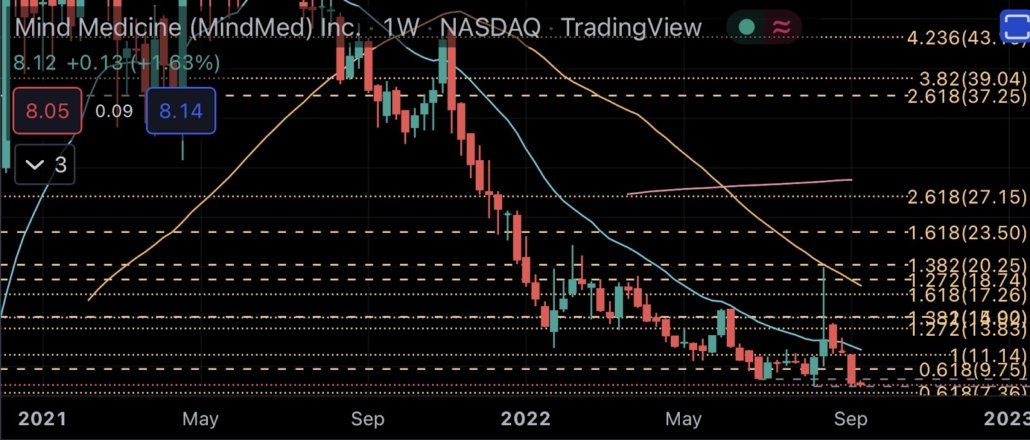
In plain view we can see MNMD’s stock price bouncing between Fib levels all over the chart.
Where’s MNMD now?
Since hitting an all time high og $86.23/share in May 2021, the stock consistently plummeted, reaching a local bottom of $7.86/share yesterday, September 13, 2022 – representing a 90.9% reversal. Investors holding MNMD for one year are currently down about 76%, YTD holders are down approximately 65%, and six month holders are down around 6% (real time market data at press time).
According to the chart’s technicals, MNMD hasn’t been a buy since its price dipped below the 20W EMA in July 2021, and it still isn’t. The 20 week exponential moving average (20W EMA) in blue and the 50 week simple moving average (50W SMA) in gold are both sloping downwards at a steep rate. No stock is a buy when a chart is upside down like MNMD. It’s just that simple to determine if the stock is a buy. Quick answer – NO!
An upside down chart is a negative situation with the shorter term moving averages below the longer term ones. A healthy chart will showcase the 20W EMA above the 50W SMA, for example. When the 20 moves above the 50, it’s a positive indicator called a Golden Cross. When the opposite happens, it’s a negative indicator called a Death Cross. Speaking of a Death Cross, let’s zoom in on the daily chart once again for a real time example.
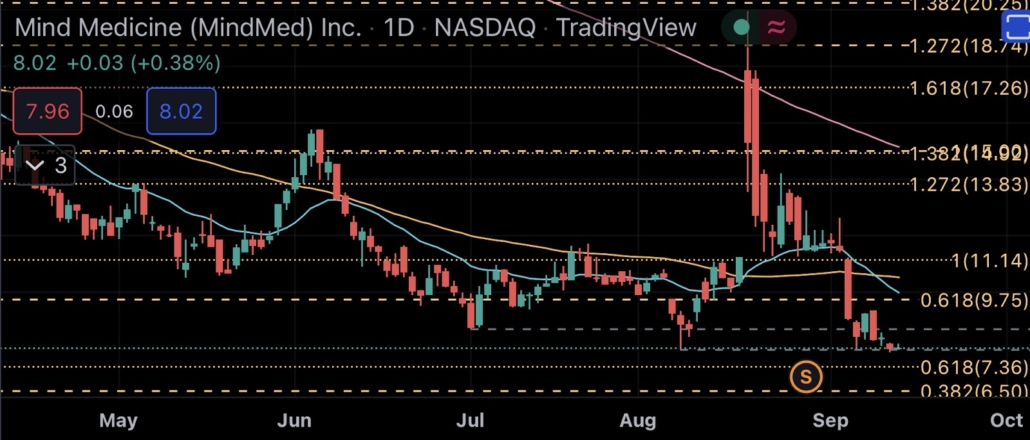
MNMD stock experienced a Death Cross earlier this week, as shown by the 20D EMA crossing below the 50D SMA, and represents a huge red flag to professional gamblers, indicating pain can worsen as sellers are in firm command of the price action. Fibonacci levels help navigate these price capitulations, as the chart shows MNMD’s price constantly moving down from mid August 2022 until today, hitting each Fib level on the way down just like… a (spiral) staircase!
MNMD’s next obvious price support levels, below its local bottom, are $7.36 and $6.50. If there’s a sustained breach below $6.50/share, don’t forget about the $5.03 level from earlier in our analysis. All things connect. In fact, you can see how the dotted Fib’s 138.2% level coincides exactly with the dashed Fib’s 100% level. Funny how that works! Guaranteed it won’t be the last time you see something similar when you start playing with Fibonacci numbers.
Reverse Split
What happened in August that caused such volatility? MNMD’s stock price fell out of compliance with the Nasdaq’s covenant of a $4/share minimum, facing potential delisting, and moving back to the OTC Markets. Just as a company will split their stock price when it becomes too high for psychological and liquidity reasons, companies can also do a reverse split to make their price per share higher. MNMD multiplied their stock price by a factor of 15, thus reducing the outstanding share count by that same denominator.
However, reverse splits are overwhelmingly devastating for shareholders. Instead of adding liquidity to the market by making the purchase price more attractive to retail traders, this strategy creates more artificial scarcity by lowering the share count, attracting short sellers, and subjecting the stock to more volatility. I can’t recall a reverse split situation in which the stock didn’t fall at least 60% after the irrational, unsustainable announcement pump. MNMD’s local bottom of $7.86/share represents a move approximately 61% lower thus far.
Further downside is expected, but not nothing is etched in stone. Investing like a professional isn’t difficult, it just requires discipline not succumbing to FOMO and hype, as well as a bit of knowledge about price movements, market momentum, and how to read a stock chart with moving averages and Fibonacci levels. My Math Over Myth Primer explains certain terminology in more depth and detail to develop a sound gambling strategy.
Conclusions
MNMD is underperforming the major ETFs over the past year by large gaps. The relative outperformance by the S&P 500, Nasdaq 100, and Biotech ETFs showcase how passively betting on the house through ETFs is more consistent and diversified, with less stress and worry, even during a bear market.
After this Fibonacci technical analysis deep dive, I’m certainly not advocating a passive ETF strategy, but rather highlighting the disparity between blindly buying stocks that carry “an ability to disrupt, innovate, and change health care” hype versus utilizing provable metrics to determine if price movements and market momentum paint a positive or negative picture.
You don’t need to catch the very bottom to successfully gamble in the stock market. Market bottoms are only formed in hindsight. All you need is patience, discipline, and a keen determination to protect your investment by steadfastly adhering to a strategy that removes romance and mythology from your decisions.
Regardless of what people tell themselves, nothing about playing the stock market involves pride or ego, it’s just about money. The more educated an investor, the more information they have to determine a risk-reward scenario which reconciles to their investment horizons and cash management. Understanding all possible price scenarios and trajectories by utilizing technical analysis tools like Fibonacci levels and moving averages give any aspiring gambler a competitive edge by bestowing the power of predetermination unto themselves. Leverage it to your full advantage.
Craig D. Schlesinger is the CFO of PSYC Corp & Spotlight Media and a market analyst with over twenty years experience predicting price movements and trend reversals in various sectors. Follow his #MathOverMyth technical analysis and him on Twitter: @psychedelicraig
Math Over Myth Primer | Math Over Myth Archive
Craig holds no positions in MNMD, QQQ, SPY or XBI