
Investing in the stock market is a fancy euphemism for gambling. But unlike traditional brick-and-mortar joints with slots, craps, and blackjack, the Crazy Capitalist Casino allows you to bet on the house – and the house always wins. How can the average retail investor adopt a healthy risk-and-reward mindset? Math Over Myth!
Retail investors are seizing more control over their respective financial futures by educating themselves, making independent investment decisions, and cutting out middlemen with perverse incentives to make money for themselves instead of you. Math Over Myth aims to remove the romance and mythology from investing to focus strictly on price movements, mathematics, and technical analysis. Today we focus on ATAI and CMPS.
Investing in emerging, disruptive, and speculative sectors of the marketplace doesn’t necessarily need to be a risky endeavor if you approach it with the right mindset, formulate a plan which allows you to remove the romance from the good time, and not second-guess the strategy during bad times.
Regardless of the long term value and growth prospects of medicinal psychedelics writ large, the public market scenario is still in a very young and volatile phase. Press releases, whether people think they’re substantive, will be treated as word salad smoke and mirrors for Math Over Myth. Why? Until one of these companies produces a tangible, effective, marketable, accessible, and affordable treatment or therapeutic, it’s all just speculation with little to no revenue relative to their cash to burn.
In the biotech space it’s simple: you buy on speculation that a company will produce some medicine. What is that company doing? How are they doing it? Does the rhetoric match the mythology? Is there tangible execution on their fundamental strategy? Where is the cash going, and what is the company getting in return for those spending outlays?
Let’s start by exploring the two psychedelic stocks currently being accumulated by Cathie Wood’s lackluster ARK Genomic Revolution ETF (BATS: ARKG), atai Life Sciences and COMPASS Pathways
atai Life Sciences (Nasdaq: ATAI)
Where’s ATAI been? My preference for analyzing any marketable security is to first zoom out and grab the big picture narrative as dictated by its chart.
ATAI went public on June 18, 2021 at a price of $15 per share, a valuation of $2.3B, but opened trading at $21 per share, spiking its market valuation to $3.2B – quite the unicorn premium for a company without dynamic revenue prospects for the foreseeable future. After topping out for the day at $22.91/share, ATAI experienced significant volatility on heavy volume and came back down to close the day around $19.50/share.
Since its IPO the stock has consistently plummeted, reaching an all time low of $2.95/share on July 13, 2022 – representing an 87% reversal from ATAI’s all time high (real time market data at press time). Investors holding ATAI for one year are currently down about 75%, YTD holders are down approximately 43%, and six month holders are down around 22%.
According to the chart’s technicals, ATAI was never a buy, and it still isn’t. Investing like a professional isn’t difficult, it just requires discipline not succumbing to FOMO and hype, as well as a bit of knowledge about price movements, market momentum, and how to read a stock chart with moving averages. My Math Over Myth Primer explains certain terminology and its significance to a sound gambling strategy.
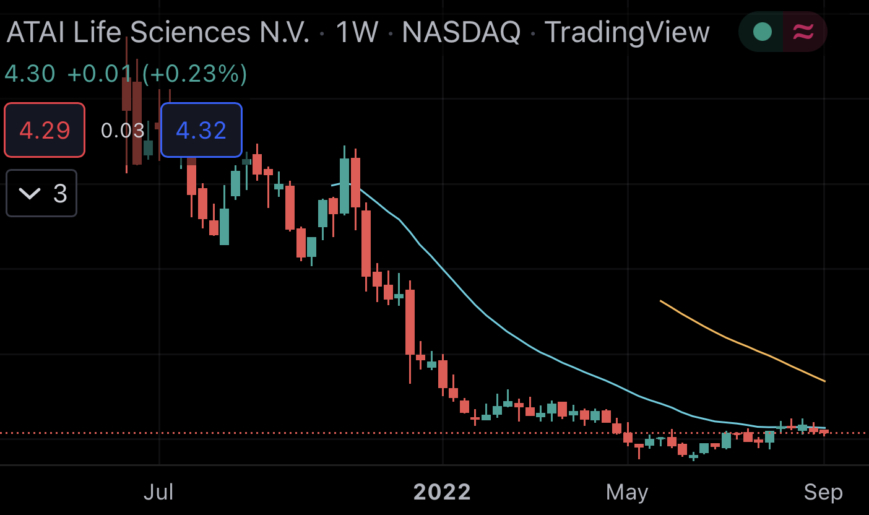
Looking at ATAI’s weekly chart, we see the 20 week exponential moving average (20W EMA) in blue and the 50 week simple moving average (50W SMA) both sloping downwards at a steep rate. No stock is a buy when a chart is upside down like ATAI. An upside down chart is a negative situation with the shorter term moving averages below the longer term ones. A healthy chart will showcase the 20W EMA above the 50W SMA, for example. When the 20 moves above the 50, it’s a positive indicator called a Golden Cross. When the opposite happens, it’s a negative indicator called a Death Cross.
Unlike a simple moving average, an exponential moving average puts more weight on the recent periods. For example, the last three weeks will be weighted heavier than the first three to indicate price momentum as well as average share price. Presently, ATAI is trading below its 20W EMA, which is an extremely serious red flag. In fact, ATAI only closed above its 20W EMA once, back in late 2021. It’s just that simple to determine if the stock is or was ever a buy. Quick answer – NO!
In 2020 and 2021, ATAI spent almost $60M total on R&D. However, executive compensation for their top three executives exceeded $15.4M in 2020, 36% more than 2020’s R&D spend. In 2021 CEO Florian Brand earned 26.5M+ in total compensation. That’s quite the outsized pay day for the CEO of a company whose stock was in a free fall, erasing shareholder value for those who bought the IPO, while company insiders made a handsome profit on IPO day. Despite my focus on technical analysis, this fundamental imbalance is concerning and raises even more serious red flags.
COMPASS Pathways (Nasdaq: CMPS)
Where’s CMPS been?
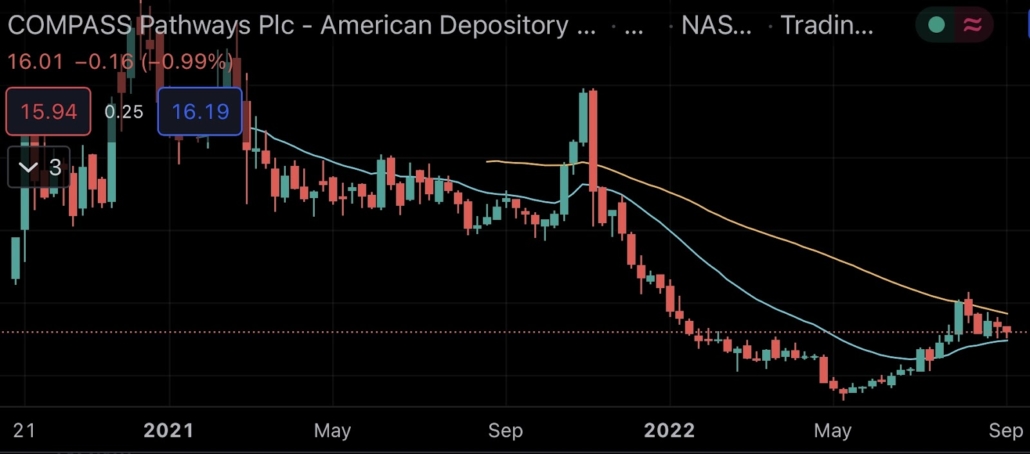
CMPS went public on September 18, 2020 and closed at a price of $29/share, surging over 70% from $17/share during its first trading day and bringing its market valuation up to almost $1B, – quite the unicorn premium for another company without revenue prospects for the foreseeable future. The stock’s auspicious IPO kicked off a rally that brought CMPS to an all time high of 61.69/share during the last week of December 2020.
Since that short lived parabolic rally, CMPS stock has consistently plummeted, reaching an all time low of $6.54/share during the week of May 11, 2022 – representing an 89% reversal from CMPS’s all time high (real time market data at press time). Investors holding CMPS for one year are currently down about 54%, YTD holders are down approximately 31%, but six month holders are up around 22%.
According to the chart’s technicals, CMPS hasn’t been in buy territory since late February 2021 and it still isn’t. Looking at CMPS’s weekly chart, we see it’s still upside down, with the 20W EMA (blue) and the 50W SMA (gold) both sloping downwards at a steep rate, until the 20W started to flatten out earlier this summer. CMPS is presently trading above its 20W EMA but below its 50D SMA, which means the bears can still control the price action. It’s just that simple to determine if the stock is a buy. Quick answer – NO!
In 2020 and 2021, CMPS spent almost $67.4M total on R&D. However, their General and Administrative (G&A) spend over the same period also exceeded $67M. That’s quite the outsized earmark going to executives of a company whose stock was in a free fall, erasing shareholder value for those who bought the IPO, while company insiders made a handsome profit on IPO day. CMPS’s G&A spend from 2020 through 2021 even eclipses the company’s 2022 revenue expectations of $51M. Despite my focus on technical analysis, this fundamental imbalance is concerning and raises serious red flags.
Conclusions
There are no mythical Puff the Magic Dragon or fabled Unicorn stocks that are a panacea to all your money goals. Regardless of what people tell themselves, nothing about playing the stock market involves pride or ego, it’s just about money. The more educated an investor, the more information they have to determine a risk-reward scenario which reconciles to their investment horizons and cash management. Individual stock picking is largely a fool’s errand sucker bet which makes people seem smart in good times, when it’s actually just fortunate timing and luck.
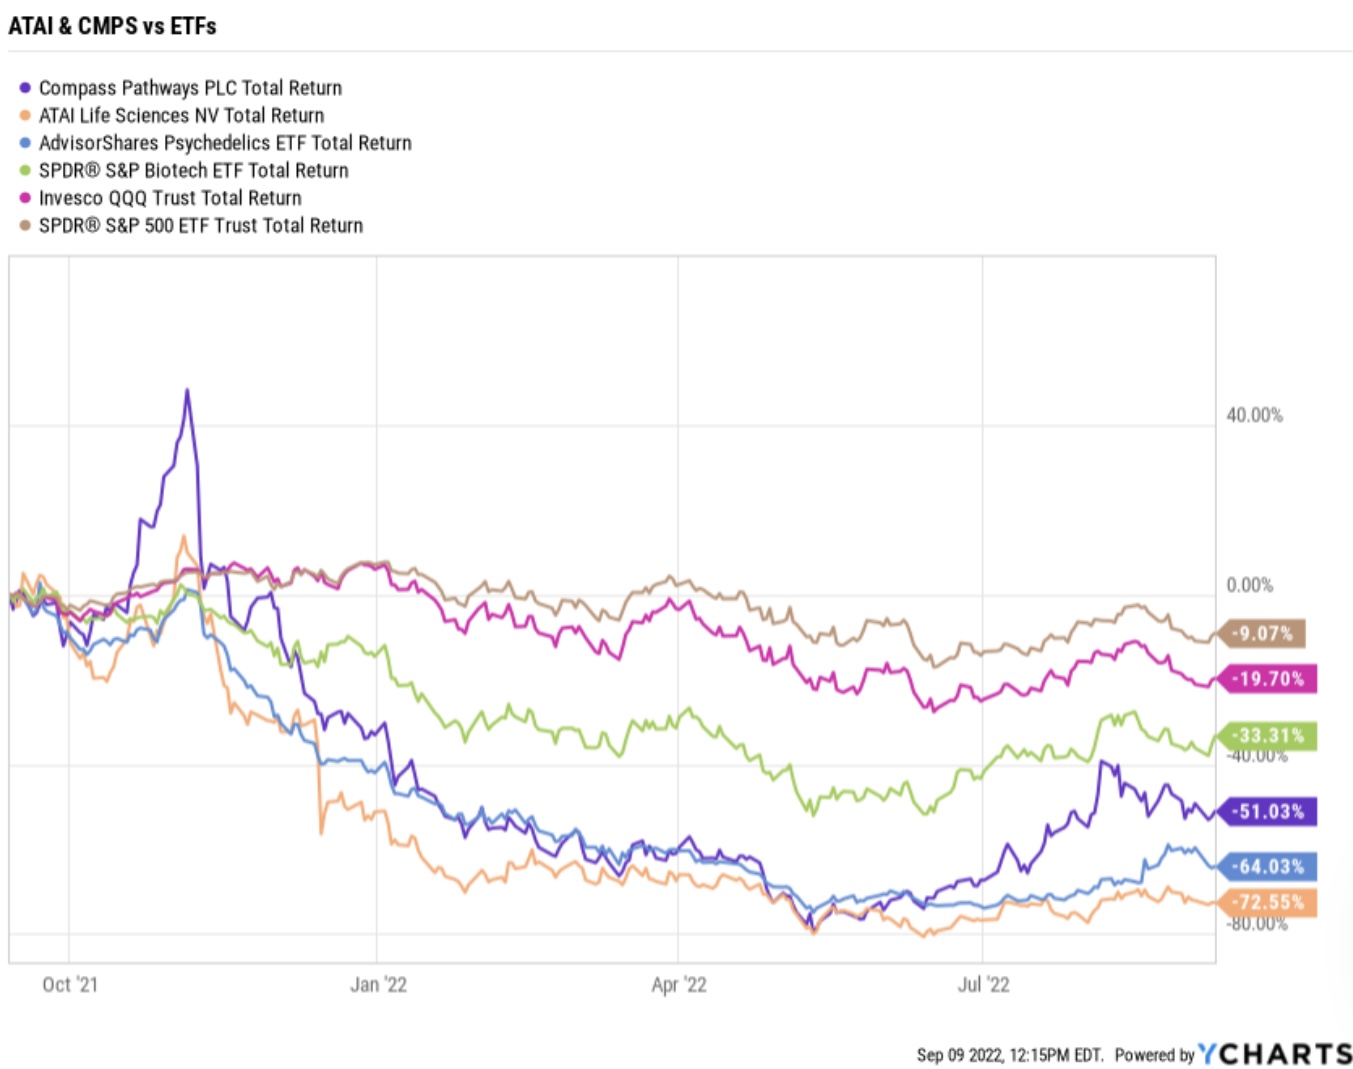
ATAI and CMPS are underperforming the major ETFs over the past year by large gaps. The relative outperformance by the S&P 500, Nasdaq, and Biotech sector showcases how passively betting on the house through ETFs is more consistent and diversified, with less stress and worry, even during a bear market.
I’m not necessarily advocating a passive ETF strategy, but rather highlighting the disparity between blindly buying stocks that carry “an ability to disrupt, innovate, and change health care” hype versus utilizing provable mathematic metrics, known as technical analysis, to determine if price movements and market momentum paint a positive or negative picture. You don’t need to catch the very bottom to successfully gamble in the stock market. All you need is patience, discipline, and a keen determination to protect your investment by steadfastly adhering to a strategy that removes romance and mythology from your decisions.
Any professional poker player will tell you to muck your cards the moment you know you can’t win. There’s nothing wrong with taking a small loss, moving to the sidelines, and reassessing before jumping back in the action. The name of the game is minimizing losses and maximizing gains – and in any game of risk and reward, losses are all in the game.
Perhaps Robert DeNiro’s Heat (1995) character Neil McCauley said it best, “Don’t let yourself get attached to anything you are not willing to walk out on in thirty seconds flat if you feel the heat coming around the corner.”
Craig D. Schlesinger is the CFO of PSYC Corp & Spotlight Media and a market analyst with over twenty years experience predicting price movements and trend reversals in various sectors. Follow his #MathOverMyth technical analysis and him on Twitter: @psychedelicraig
Craig holds no positions in ATAI, ARKG, CMPS, PSIL, QQQ, SPY, or XBI